| Seattle metro area: Homebuyer’s typical monthly mortgage payments | |||
| Average mortgage rate (30-year fixed) | Median home-sale price | Typical monthly mortgage payment | |
| Late October 2021 | 3.14% | $723,000 | $3,218 |
| Late October 2022 | 7.08% | $762,000 | $4,863 |
| Late October 2023 | 7.76% | $774,500 | $5,095 |
Leading indicators
| Indicators of homebuying demand and activity | ||||
| Value (if applicable) | Recent change | Year-over-year change | Source | |
| Daily average 30-year fixed mortgage rate | 7.51% (Nov. 2) | Down from 7.9% a week earlier | Up from 7.09% | Mortgage News Daily |
| Weekly average 30-year fixed mortgage rate | 7.76% (week ending Nov. 2) | Down slightly from 7.79% a week ago; still near highest level in 23 years | Up from 7.08% | Freddie Mac |
| Mortgage-purchase applications (seasonally adjusted) | Down 1% from a week earlier (as of week ending Oct. 27) | Down 22% to its lowest level in nearly 30 years | Mortgage Bankers Association | |
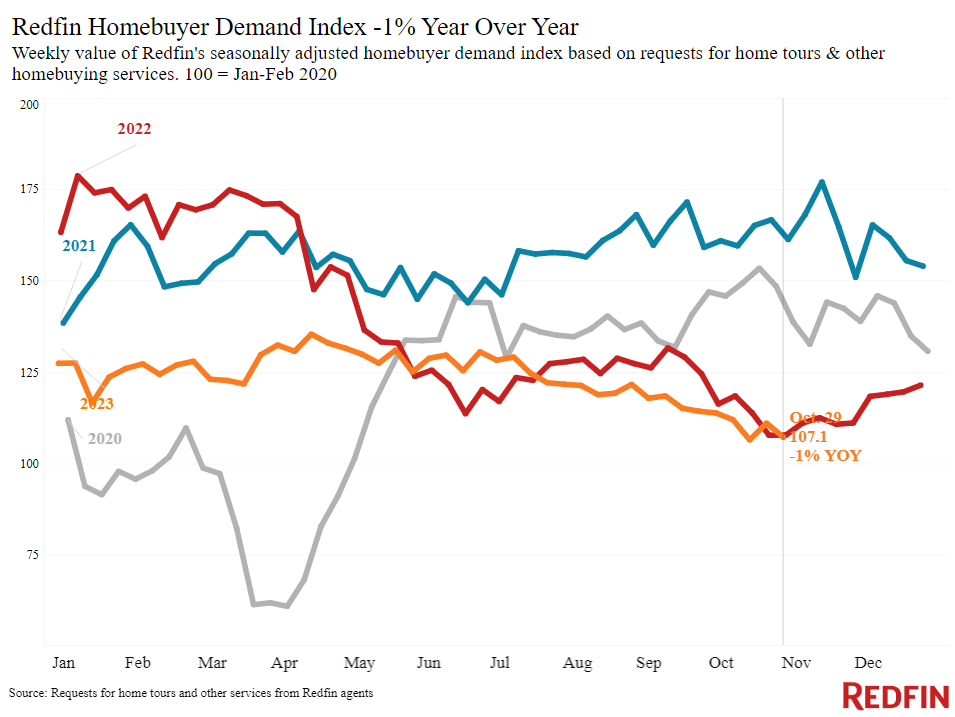
| Redfin Homebuyer Demand Index (seasonally adjusted) | Down 6% from a month earlier (as of the week ending Oct. 29) | Down 1% | Redfin Homebuyer Demand Index, a measure of requests for tours and other homebuying services from Redfin agents | |
| Google searches for “home for sale” | Down 6% from a month earlier (as of Oct. 28) | Down 12% | Google Trends | |
| Touring activity | Down 16% from the start of the year | At this time last year, it was down 27% from the start of 2022 | ShowingTime, a home touring technology company | |
Key housing-market data
| U.S. highlights: Four weeks ending October 29, 2023
Redfin’s national metrics include data from 400+ U.S. metro areas, and is based on homes listed and/or sold during the period. Weekly housing-market data goes back through 2015. Subject to revision. |
|||
| Four weeks ending October 29, 2023 | Year-over-year change | Notes | |
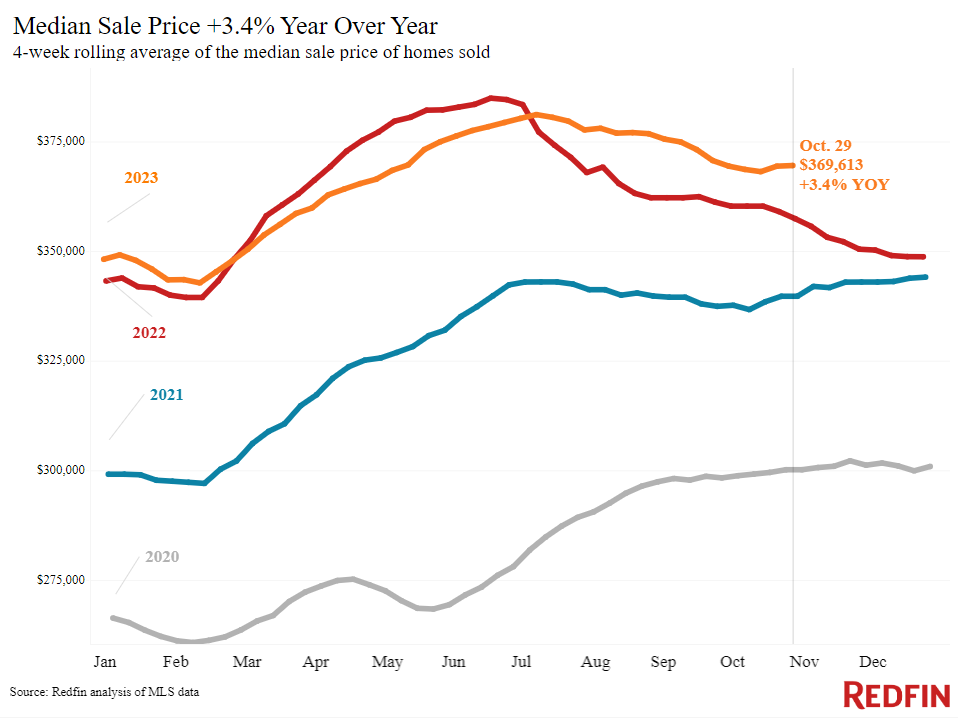
| Median sale price | $369,613 | 3.4% | Prices are up partly because elevated mortgage rates were hampering prices during this time last year |
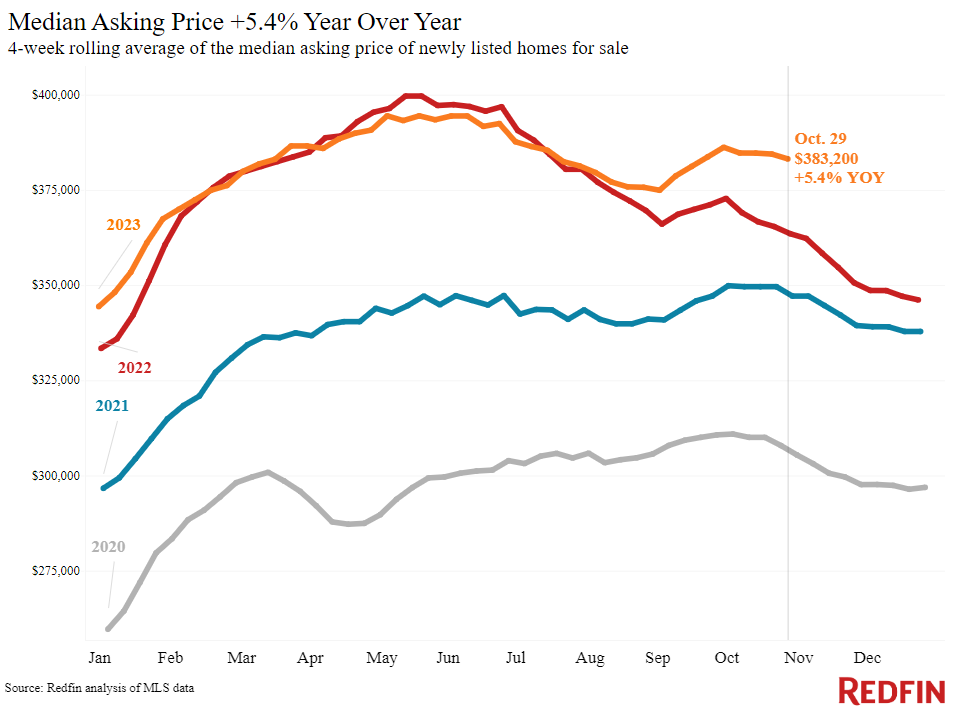
| Median asking price | $383,200 | 5.4% | Biggest increase in a year |
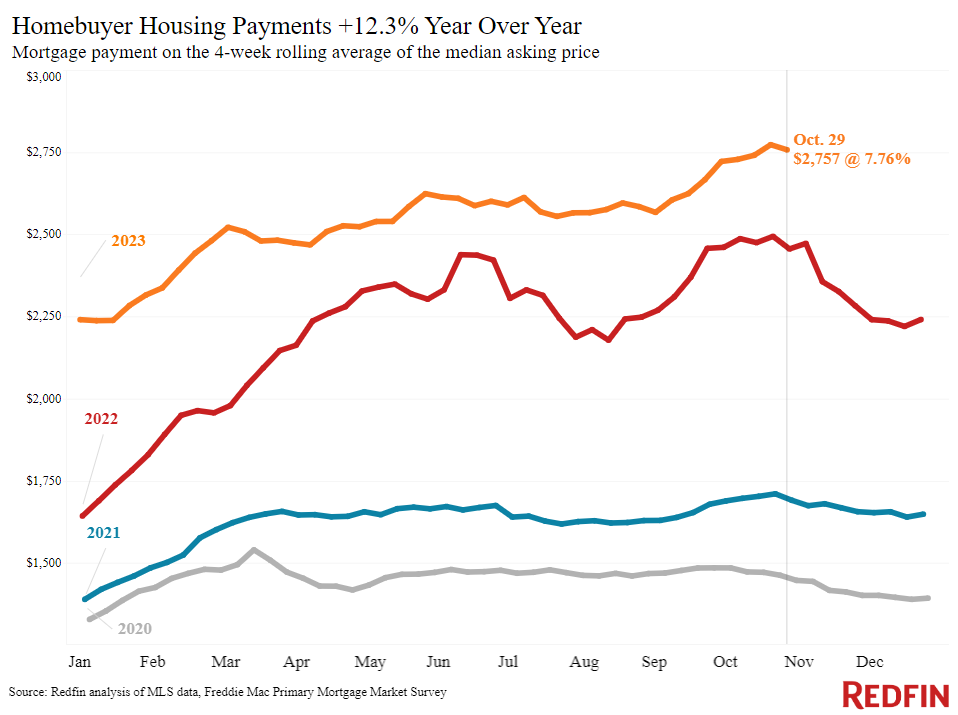
| Median monthly mortgage payment | $2,757 at a 7.76% mortgage rate | 12% | $16 shy of all-time high set a week earlier |
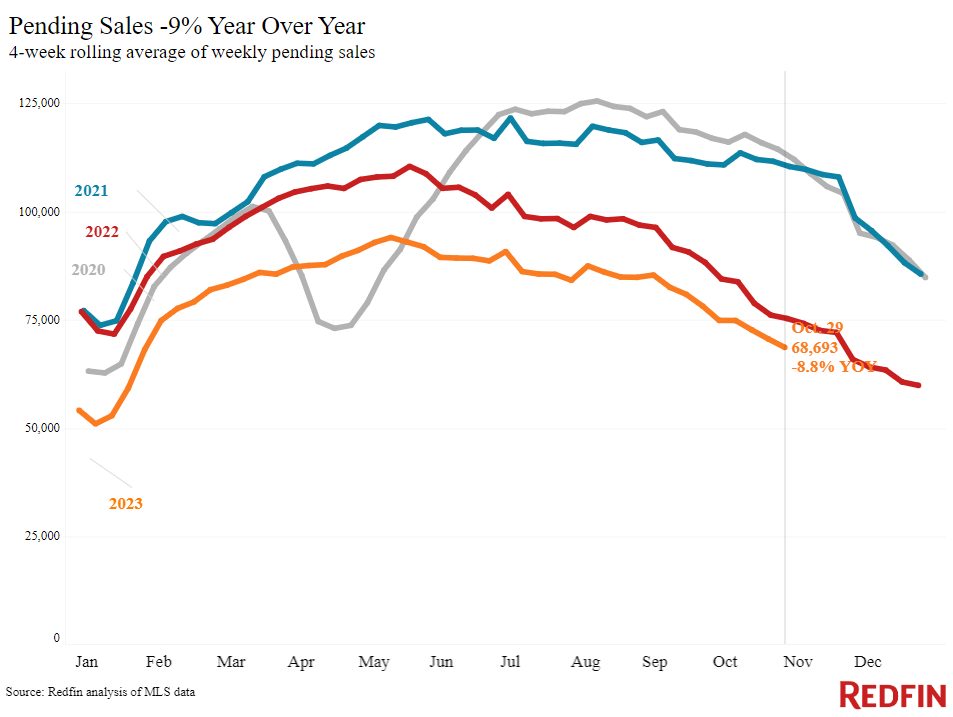
| Pending sales | 68,693 | -8.8% | |
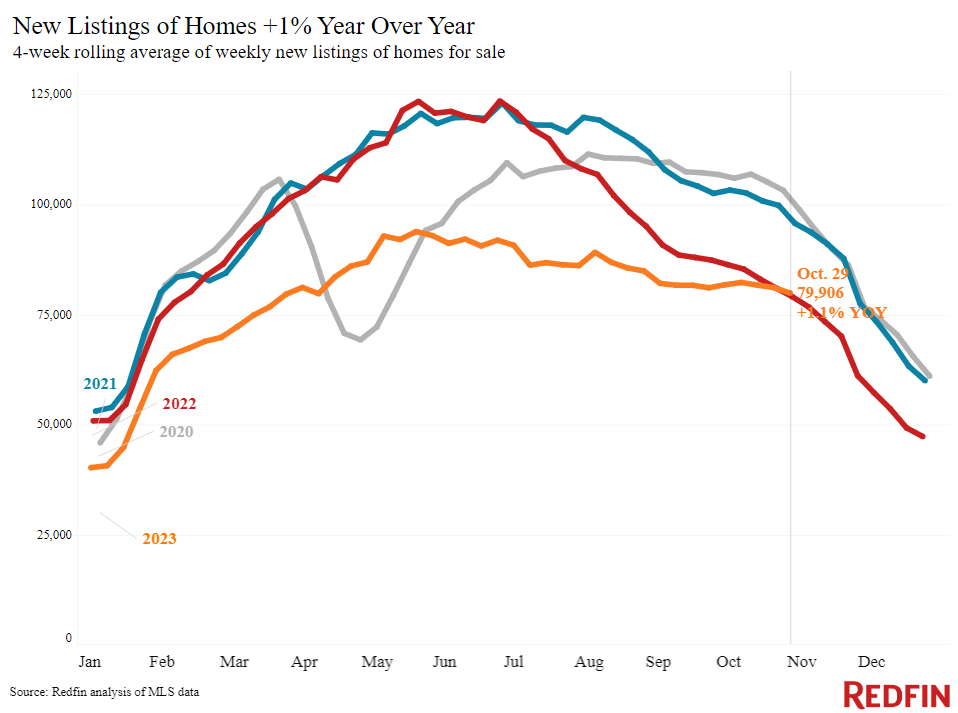
| New listings | 79,906 | 1.1% | Second year-over-year increase since July 2022; the first was a week earlier. The increase is partly because new listings were falling at this time last year. |
| Active listings | 858,570 | -10.2% | Smallest decline since July |
| Months of supply | 3.7 months | +0.3 pts. | Highest level since February
4 to 5 months of supply is considered balanced, with a lower number indicating seller’s market conditions. |
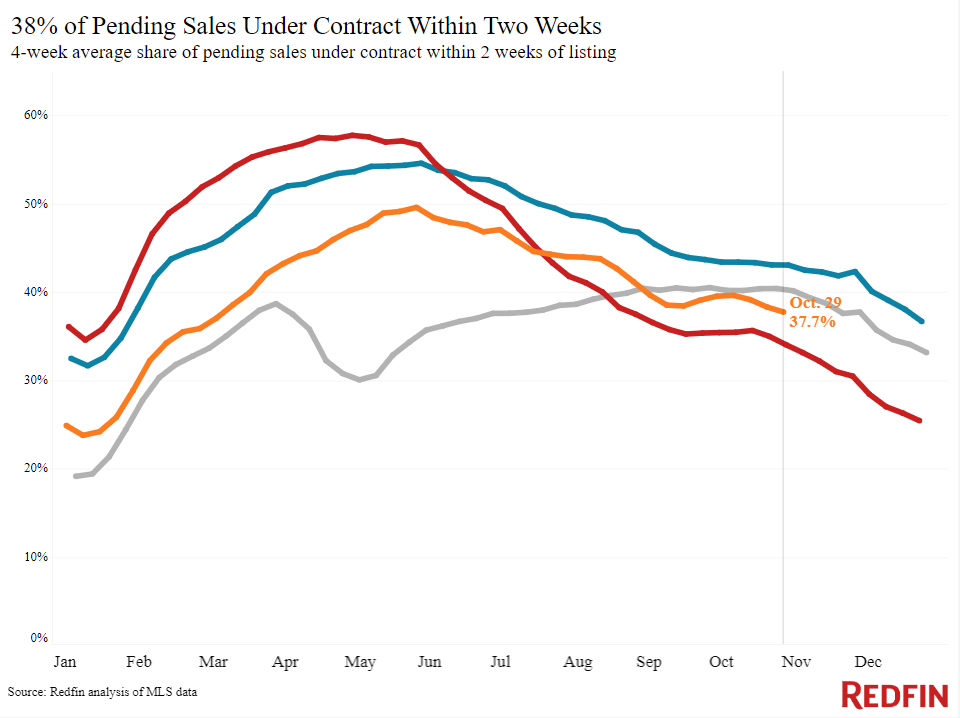
| Share of homes off market in two weeks | 37.7% | Up from 34% | |
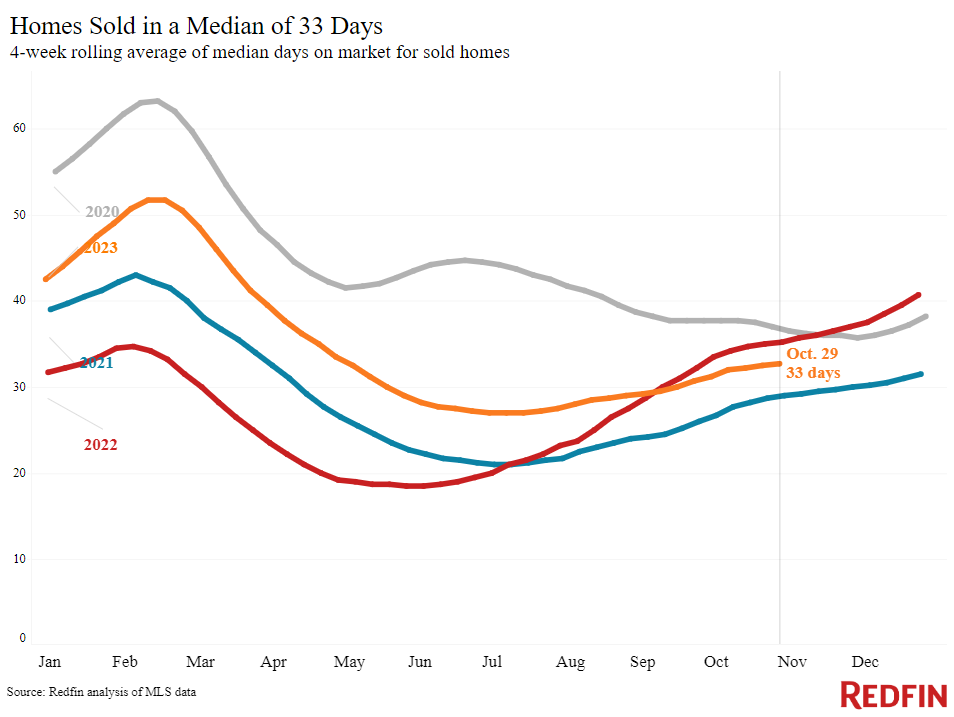
| Median days on market | 33 | -2 days | |
| Share of homes sold above list price | 29.4% | Up from 28% | |
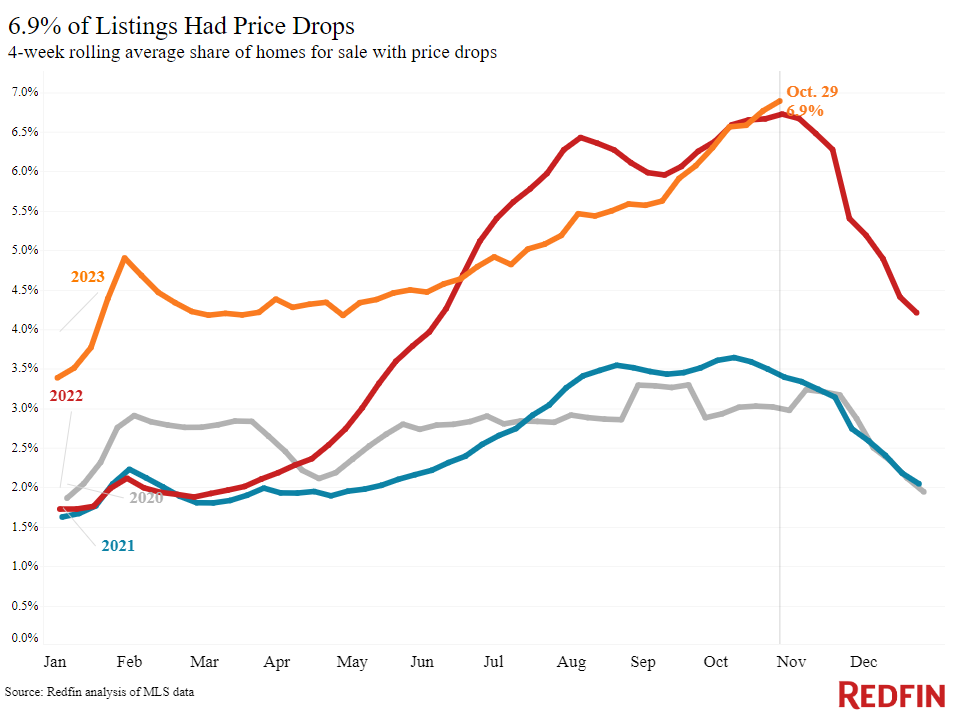
| Share of homes with a price drop | 6.9% | +0.2 pts. | Record high |
| Average sale-to-list price ratio | 99.1% | +0.4 pts. | |
| Metro-level highlights: Four weeks ending October 29, 2023
Redfin’s metro-level data includes the 50 most populous U.S. metros. Select metros may be excluded from time to time to ensure data accuracy. |
|||
| Metros with biggest year-over-year increases | Metros with biggest year-over-year decreases | Notes | |
| Median sale price | Newark, NJ (14.8%)
San Jose, CA (13.6) Anaheim, CA (11.5%) West Palm Beach, FL (10.6%) Columbus, OH (10.3%) |
Austin, TX (-6%)
Fort Worth, TX (-3%) Tampa, FL (-1.8%) Portland, OR (-1.2%) San Antonio, TX (-1.1%) |
Declined in 5 metros |
| Pending sales | Austin, TX (2%)
Tampa, FL (1.3%) Las Vegas (0.2%) |
Portland, OR (-23.5%)
Sacramento, CA (-21.6%) San Antonio, TX (-21.6%) Seattle (-18.1%) Newark, NJ (-16.4%) |
Declined in all but 3 metros |
| New listings | Phoenix (13.9%)
San Jose, CA (12.7%) Miami (12.1%) Tampa, FL (10.7%) West Palm Beach, FL (10.6%) |
Atlanta (-22.5%)
Portland, OR (-14.7%) Seattle (-12%) Nashville, TN (-10.2%) San Antonio, TX (-9.8%) |
Increased in 16 metros |
Refer to our metrics definition page for explanations of all the metrics used in this report.